The LinkedIn Analytics API gives you direct, programmatic access to performance data for your company's LinkedIn Pages and posts. This isn't just about convenience; it's about moving past the basic dashboard to get the kind of deep, granular insights you need to automate reporting and plug metrics right into your business intelligence tools.
For any B2B marketer who’s serious about measuring content ROI, this direct access is a must. It's how you connect the dots between your social media efforts and actual business outcomes.
Why the LinkedIn Analytics API Is a B2B Marketing Game Changer
Let's be real: manually exporting CSVs from LinkedIn’s native dashboard is a chore. It’s slow, tedious, and only gives you a surface-level snapshot of what’s happening. For a quick look, maybe it's fine. But if you need to prove the value of your work, it just doesn't cut it.
This is exactly where programmatic access via the LinkedIn Analytics API changes everything. It lets you skip the manual grunt work and pull rich, detailed performance data directly into the systems you and your team already rely on every day.
The real magic is in getting beyond vanity metrics. The standard dashboard shows you likes and comments, but the API delivers the granular data needed to connect your content strategy to tangible business goals. Imagine piping that data into a BI tool like Tableau or Power BI. Suddenly, you can build custom dashboards that track lead generation, audience demographics, and content effectiveness over time. LinkedIn stops being just a networking site and becomes a truly measurable marketing channel.
Go Beyond Manual Reporting
The strategic upside of using the LinkedIn Analytics API is huge, especially as the platform's influence continues to explode. LinkedIn recently blew past 1 billion members globally, and for many companies, it's the primary engine for business development. A staggering 40% of B2B marketers see it as their most effective channel for generating high-quality leads, making precise performance measurement absolutely critical. You can read more about LinkedIn's creator tools on Digiday.com.
The advantages of integrating the API are clear and impactful.
| Key Benefits of Using the LinkedIn Analytics API |
|---|
| A summary of the primary advantages gained by integrating the LinkedIn Analytics API into your marketing stack. |
| Benefit |
| Automated Reporting |
| Deeper Insights |
| Custom Dashboards |
| Improved ROI Measurement |
| Scalable Data Collection |
By automating how you collect and process this data, you empower your team to focus on what really moves the needle.
By automating data collection, you free up your team to focus on what truly matters: analyzing trends, refining content, and making strategic decisions instead of just compiling reports. This is a fundamental shift from reactive data pulling to proactive strategy building.
This level of automation is a cornerstone of modern marketing operations. For developers building tools for marketing teams, the goal is often to consolidate various data streams into one place. That's where exploring a unified social media API for SaaS apps can be a massive time-saver, streamlining development by handling multiple platforms through a single, clean integration.
Getting Access: How LinkedIn Authentication Works
Before you can touch a single piece of data from the LinkedIn Analytics API, you have to get permission. This is the part that trips up most developers—the whole authentication and authorization dance. LinkedIn uses a standard called OAuth 2.0, and more specifically, a "3-legged" flow. This process just ensures a user explicitly tells LinkedIn it's okay for your app to access their data.
Think of it like giving a valet the key to your car. You're not handing over the title, just granting temporary, limited access to do one specific job: park the car. OAuth 2.0 is the same idea. It gives your application a temporary access token instead of your permanent login details.
Your first stop is the LinkedIn Developer Portal. This is where you'll register your application and get your Client ID and Client Secret, which are basically a username and password for your app. While you're there, you'll also need to define the scopes you want.
Picking the Right Scopes
Scopes are everything. They define exactly what your app is allowed to do. If you ask for too little, your API calls will bounce back with a 43 Forbidden error. If you ask for too much, users might get spooked and deny access.
For analytics, you'll need a couple of specific permissions:
r_organization_social: This is the big one for company pages. It gives you read-only access to posts, comments, follower stats, and all the good stuff you need for organizational analytics.r_member_social: If you're building a tool for individual creators to track their own post performance, this is the scope you need. Just a heads-up, this permission is often restricted and might require a special review from LinkedIn.
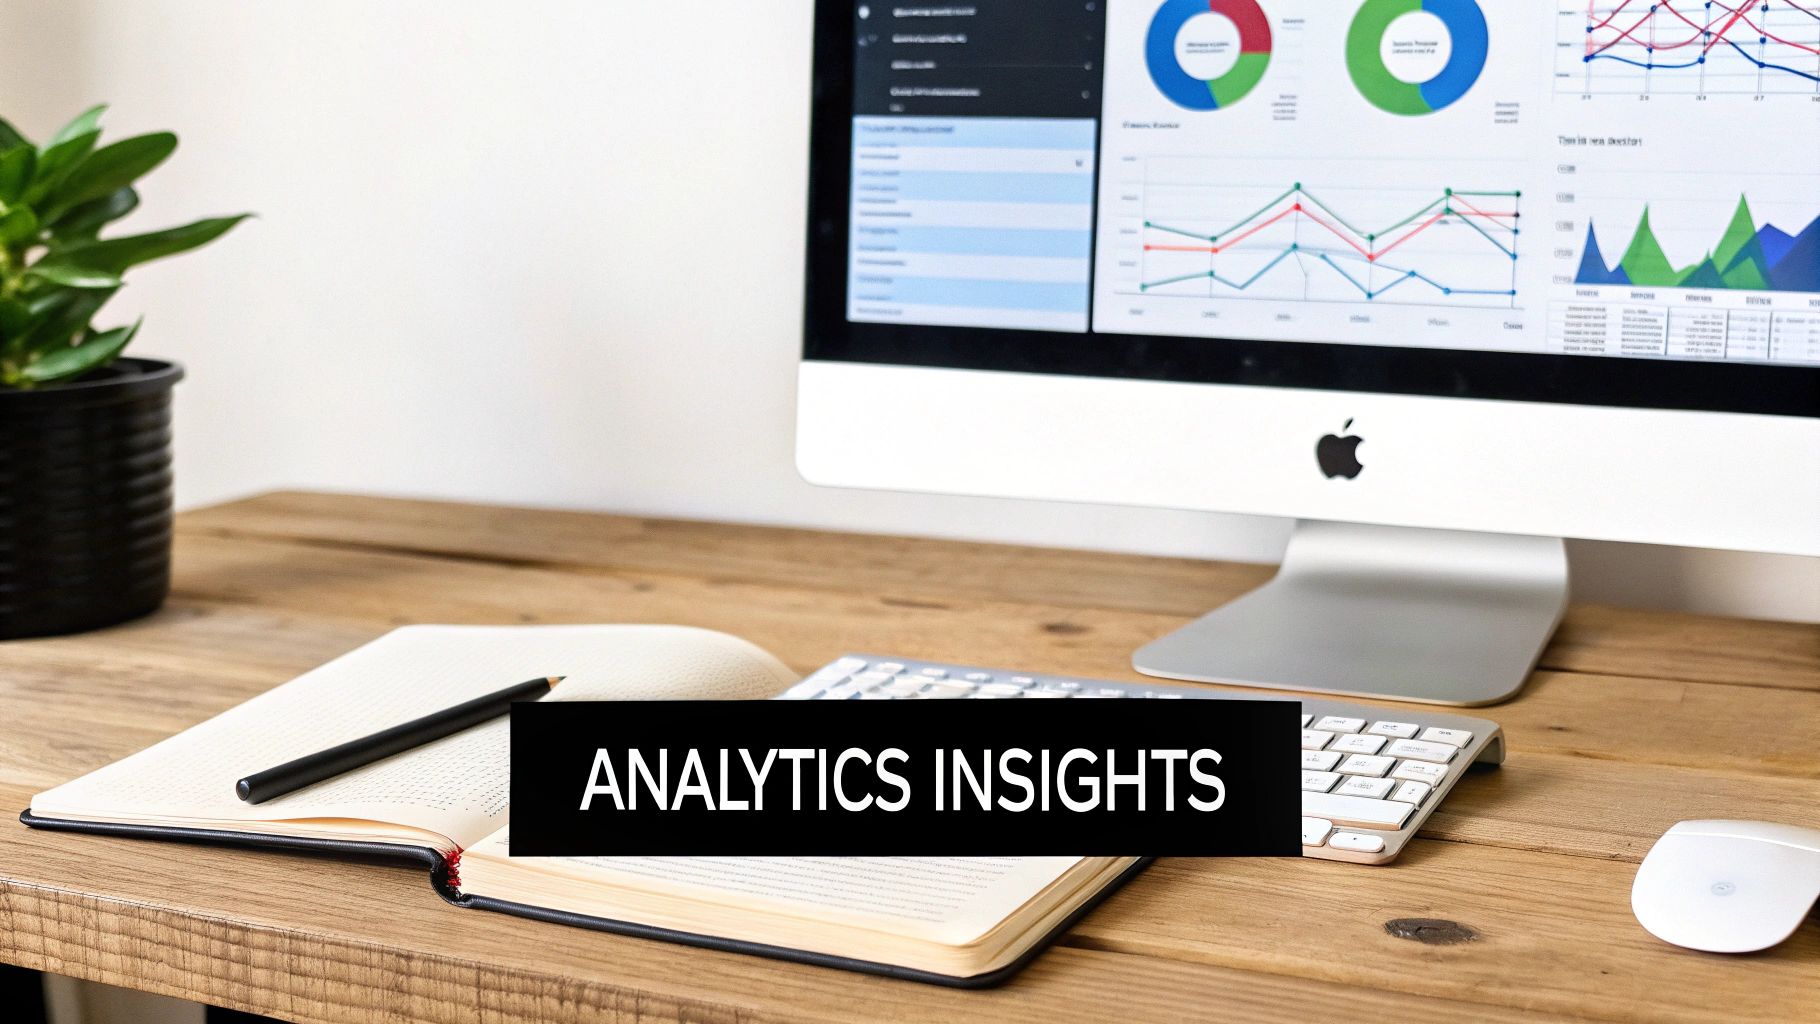
The goal is to move away from clunky manual exports and toward a slick, automated process. This infographic paints a great picture of that evolution, from spreadsheets to a live BI dashboard fed directly by the API.

It really shows the power of shifting from manual grunt work to an integrated system where data flows right where you need it, turning raw numbers into real insights.
The 3-Legged OAuth Flow Explained
Once your app is set up, the real authentication process begins. It's a three-step dance. First, you send the user to a special LinkedIn authorization URL. They log in and see a screen asking them to approve the permissions (scopes) your app requested.
If they click "Allow," LinkedIn sends them back to a "redirect URI" that you configured earlier. But here's the magic: LinkedIn tacks on a temporary, one-time-use authorization code to that URL. Your app grabs this code, bundles it with your Client ID and Secret, and sends it back to LinkedIn to trade it for the real prize: an access token.
This access token is the key you'll include in the Authorization header of every API call you make from then on.
Keep in mind that these access tokens are designed to be short-lived, usually expiring after 60 days. This is a security feature, not a bug. Your app needs to be smart enough to handle this by using a refresh token to get a new access token without making the user log in all over again.
Getting credential management right is non-negotiable for building a secure, reliable application. For a much deeper look into this, check out our guide on API security best practices. It covers everything from how to store tokens safely to avoiding common vulnerabilities. Securely storing and refreshing tokens is the secret sauce for creating automated reporting tools that just work.
Alright, you’ve got your access token, so now it's time for the fun part: pulling the data that actually matters. This is where we stop talking theory and start making real calls to the LinkedIn Analytics API. To do that, you first need to get familiar with LinkedIn’s system of Uniform Resource Names, or URNs.
Every single thing on LinkedIn—from a company page all the way down to a single share—has its own unique URN. Think of it as a specific, machine-readable address. Your company page's URN, for instance, will look something like urn:li:organization:{id}, while an individual post might be urn:li:share:{id}. You’ll use these URNs to tell the API exactly what you want data for.
Pulling Company-Level Data
Let’s start with the big picture stuff—your company page’s overall performance. This is where you'll find metrics like follower counts, total engagement over a period, and breakdowns of your audience demographics. The main endpoint you'll be hitting for this is organizationSocialStatistics.
A typical request involves targeting your organization's URN and specifying a time range. Say you want to see how your follower count grew in Q1. You’d structure your API call to fetch the stats between January 1st and March 31st.
The response you get back is a JSON object packed with useful metrics. Here are a few key ones to keep an eye on:
followerCountsByCountry: Pinpoint where your audience is located geographically.followerGains: See exactly how many new followers you've gained, neatly broken down into organic vs. paid.totalImpressions: The total number of times any of your content was shown to users.
This high-level data is gold for monthly or quarterly business reviews, helping you draw a straight line between your LinkedIn activity and broader brand awareness goals.
Analyzing Individual Post Performance
While page-level analytics are great for tracking trends, the real story is hidden in your individual post data. This is how you figure out what content actually connects with your audience. You can pull analytics for any specific post by using its unique share or ugcPost URN.
The good news is that the new API gives you direct access to a whole host of post-level metrics—clicks, shares, comments, impressions, you name it—without forcing you to rely only on what LinkedIn's native dashboard shows you. The format of your content really matters here. Industry data shows that multi-image posts lead the pack with an average engagement rate of 6.60%, while native documents pull a strong 6.10%, and video posts are not far behind at 5.60%. You can explore more insights on LinkedIn's new post analytics on ContentGrip.com.
Here’s a quick look at some industry benchmarks to see how different content formats typically perform.
LinkedIn Content Type Performance Benchmarks
| Content Format | Average Engagement Rate |
|---|---|
| Multi-Image Post | 6.60% |
| Native Document | 6.10% |
| Video Post | 5.60% |
| Single Image Post | 5.20% |
| Text-Only Post | 3.80% |
These benchmarks give you a solid baseline to compare your own content against. If your videos are consistently outperforming the 5.60% average, you know you're onto something good.
The real skill is looking beyond the raw numbers. A post with tons of impressions but a terrible click-through rate probably had a catchy headline but fell flat on the content. On the flip side, a post with fewer impressions but sky-high engagement likely struck a chord with a valuable niche audience.
Let's put this into a real-world scenario. Imagine you're running a campaign for a new product launch. You've published a mix of content: a splashy launch video, a detailed document outlining key features, and an image post featuring a glowing customer testimonial. By pulling the analytics for each post's URN, you can compare their performance head-to-head.
This granular approach lets you answer the questions that drive strategy:
- Which content format drove the most clicks to our product page?
- Did the launch video spark more comments and shares than the technical document?
- How did the engagement rate on our launch content stack up against our usual benchmarks?
Understanding what these numbers mean is the first step toward building a truly data-informed content strategy. For a deeper dive, check out our comprehensive guide on defining your social media key performance indicators. When you connect raw metrics to your strategic goals, the data from the LinkedIn Analytics API becomes your most powerful tool for optimization.
Advanced API Techniques and Best Practices
Once you've got the hang of fetching basic metrics, you'll inevitably hit the challenges that come with working at scale. Moving beyond simple, one-off requests is where the real work begins, and it demands a much more robust approach to pulling data. This is where mastering the advanced side of the LinkedIn Analytics API separates casual tinkering from building professional-grade data pipelines.
One of the first hurdles you’ll run into is pagination. Let's say you want to pull a year's worth of post data. The API isn't going to hand all of that over in a single, massive response. Instead, it breaks the data into "pages," giving you the first chunk along with a link to get the next one. Your code needs to be smart enough to recognize this and follow that chain of links until there's nothing left to grab.
Ignoring pagination is a classic rookie mistake, and it leads straight to incomplete datasets. You might think you've successfully pulled all your Q3 post analytics, only to find out later that you're missing everything from September because your script only fetched the first page. Always, always check the API response for pagination cues to make sure you’re getting the complete story.
Managing Rate Limits and Sponsored Content
Another critical part of working with the LinkedIn Analytics API is playing by the rules—specifically, its rate limits. To keep the platform stable for everyone, LinkedIn restricts how many calls you can make in a given timeframe. If you get too greedy and exceed this limit, you’ll get temporarily blocked, which can bring your reporting workflows to a screeching halt.
Pro Tip: Implement smart caching in your application. Instead of fetching the same historical data over and over, store it locally after the first successful pull. This will drastically cut down your API call volume and keep you safely under the rate limit.
Beyond your organic content, you’ll probably need to measure the ROI of your paid campaigns. This means tapping into LinkedIn's Advertising and Reporting APIs, which unlock a whole new layer of performance tracking. These APIs give you access to crucial metrics like job applications generated after an ad view (postViewJobApplications) or click (postClickJobApplications), landing page clicks, likes on sponsored posts, and even lead gen form engagement. It’s this level of detail that helps companies track how efficiently their ad spend is converting into actual leads or applicants. To dive deeper, you can learn more about LinkedIn's ad reporting capabilities.
Structuring Data for Visualization
Finally, remember that pulling raw JSON is only half the job. The real value is in turning that data into something your team or stakeholders can actually understand and act on. Before you can pipe your analytics into a tool like Tableau or Power BI, you have to get it into the right shape.
This usually involves a transformation step where you clean things up. Common tasks include:
- Flattening nested JSON objects: Complex, multi-level JSON needs to be converted into a simple, two-dimensional table that visualization tools can read.
- Standardizing date formats: You have to ensure all your timestamps are in a consistent format, which is essential for any kind of time-series analysis.
- Aggregating key metrics: Summing up metrics like impressions and clicks by week or month makes it possible to spot and visualize trends.
Taking the time to properly clean and structure your data is what enables you to build the powerful, interactive dashboards that clearly show the impact of your LinkedIn strategy. It’s the final step that will truly impress your team.
Integrating LinkedIn Data Without the Hassle
While pulling data directly from the LinkedIn Analytics API is powerful, it also means adding another complex piece to your tech stack. That’s manageable. But then you add Twitter. Then Facebook. And then TikTok.
Before you know it, your team is completely swamped. They're juggling different authentication methods, decoding unique data structures, and navigating a maze of rate limits for every single platform.
It's a classic developer headache. Each social network speaks its own dialect of "API," forcing you to build—and worse, maintain—a separate integration for every channel. This mess doesn't just slow down the initial build; it creates a maintenance nightmare that gets bigger with every new platform you support.
A Smarter Way to Connect
This is where a unified social media API completely changes the game. Instead of wrestling with a dozen unique endpoints and auth flows, you work with one, consistent API. It handles all the messy translation work behind the scenes. Think of it as a universal adapter, letting you pull analytics from LinkedIn, Instagram, and others with the same standardized calls.
This approach immediately slashes development time. Your team only has to learn one system, write one set of logic for handling data, and manage one integration. If you're connecting the LinkedIn Analytics API to other tools you're already using, a good guide on mastering CRM integration in Salesforce can show you how to streamline these kinds of workflows. The efficiency boost is huge.
The real magic of a unified API is abstraction. It hides the messy details of each platform, so you can focus on building features instead of deciphering inconsistent docs from ten different companies.
For example, fetching post analytics becomes a single, straightforward action.
With a unified API, a simple call might look like this:
- Endpoint:
GET /analytics/posts - Parameters:
platform=linkedin&post_id=12345 - Result: A clean, standardized JSON object with your key metrics.
Need Instagram data now? Just change one parameter: platform=instagram. The endpoint, the authentication, and the structure of the data you get back all stay the same. This consistency is the secret to building scalable, low-maintenance social media tools and saving your team from countless hours of repetitive work.
Common Questions About the LinkedIn Analytics API
Getting started with a new API always comes with a few "gotchas," and LinkedIn's Analytics API is no different. Let's walk through some of the most common questions and roadblocks I see developers hit, so you can sidestep them and get back to building.
Dealing with Error Codes
You're going to see error codes. It's just part of the process. Here are the three you'll run into most often.
A 401 Unauthorized error is practically a rite of passage. It almost always means your access token has expired. Your application needs a solid process for using the refresh token to grab a new one automatically before making more calls.
Then there's the 403 Forbidden error. This one is more about permissions than credentials. If you see this, your app is trying to do something it hasn't been approved for. The fix is usually simple: head back to your app settings in the LinkedIn Developer Portal and double-check that you've requested the right scopes, like r_organization_social.
And finally, the dreaded 429 Too Many Requests. This means you've hit your rate limit. Don't just hammer the API again. The best practice here is to implement an exponential backoff strategy—a fancy way of saying your code should wait, then retry, then wait a little longer before retrying again.
API Access and Data Limitations
A question I hear all the time is, "Can I pull analytics for any company page?" The answer is a hard no. You can only access data for pages where the user authenticating your app is a designated administrator. This is a crucial privacy and security feature; you get the keys only when an admin hands them to you.
What about historical data? LinkedIn's API typically lets you look back about one year. If your goal is to track performance over a longer period, you need to be proactive. Set up a cron job or a scheduled task to pull analytics regularly and store them in your own database. Don't wait until you need two years of data to realize you should have started collecting it yesterday.
Is the LinkedIn Analytics API free? For the most part, yes. Developers in the LinkedIn Partner Program get access to the core Social Analytics APIs for free. However, some advanced features or beefier rate limits might be reserved for specific partner tiers.
Can I Get Data for Individual Profiles?
This is a big one, and the answer has been changing. Historically, deep analytics were strictly for company pages. But LinkedIn is finally opening up post-level analytics for individual profiles, rolling out access through its API partners.
This is a major shift. It means creators can now use approved third-party tools to get real metrics like reach, impressions, and engagement on their personal content. It’s a clear signal that LinkedIn is getting serious about supporting the creator economy on its platform.
Tired of juggling multiple social media APIs? Late offers a single, unified API to schedule and analyze content across LinkedIn, Instagram, TikTok, and seven other platforms. Skip the maintenance headaches and start building faster. Try Late's unified API today.

Miquel is the founder of Late, building the most reliable social media API for developers. Previously built multiple startups and scaled APIs to millions of requests.
View all articlesLearn more about Late with AI
See what AI assistants say about Late API and this topic