Making Sense of Social Media Key Performance Indicators
Running a social media strategy without tracking your progress is like setting off on a road trip without a map. You’re definitely moving, but are you actually getting any closer to your destination? This is where social media key performance indicators (KPIs) come in. They are the compass that turns random activity into a focused journey toward your goals.
What Are KPIs, Really?
Imagine your car’s dashboard. You have all sorts of gauges showing your speed, engine temperature, and RPMs. These are all metrics—they provide data. But the gauges that truly matter for completing your trip are the fuel level and the check-engine light. These are your key performance indicators. A KPI is a specific metric you choose to measure progress on a vital business objective, helping you separate the critical signals from the background noise.
This distinction is essential. For example, a high follower count might look great on the surface, but it can be misleading. A massive audience that never likes, comments, or shares is like a beautiful storefront with no customers coming inside. This is a vanity metric. True insight comes from tracking data that reflects how your audience actually behaves, turning a flood of numbers into a clear story about your brand's impact.
Why Your Business Needs a KPI Compass
KPIs are the bridge connecting your daily social media tasks to real business outcomes. They transform vague ambitions like “improve brand awareness” into concrete, measurable targets. Instead of a fuzzy goal, you can set a specific KPI, like "increase average post reach by 15% this quarter," which makes your success easy to track and prove.
A great starting point for awareness is reach, a KPI that measures the number of unique individuals who see your content. In a crowded digital space, understanding your reach isn't just a good idea; it's a necessity. With a projected 5.42 billion social media users worldwide by 2025 and the average person active on 6.83 different platforms each month, simply being present is not enough. Your KPIs confirm whether your message is actually cutting through the clutter. You can find more social media statistics here.
Choosing the right KPIs also requires you to think about user psychology. Are people just scrolling past your posts, or are they stopping to comment, share, or click a link? Well-defined social media key performance indicators help you measure if your content truly connects with people and inspires them to act, rather than just passively consume. This is the fundamental difference between measuring your output (what you post) and the outcome (the impact you create).
By defining and tracking the right KPIs, you gain clarity and create a direct line between your social media activities and business growth. It’s how you move from a "post and hope" approach to a predictable, strategic operation.
The Core Four: Essential Metrics Every Brand Should Track
Think of your social media key performance indicators as the dashboard in your car. A single number, like your follower count, is just the odometer—it tells you how far you've gone, but not how well you're driving. To truly understand performance, you need to check the vital gauges: Reach, Engagement, Conversion, and Brand Sentiment. These four metrics work together, telling a complete story about your brand's health and direction.
From Eyeballs to Interactions: Reach and Engagement
The first piece of the puzzle is Reach. It simply answers the question, "How many unique people saw my content?" Think of it like casting a fishing net. Reach tells you how wide your net is, but it doesn't tell you if you've caught anything. A broad reach is a great start, but it's what happens next that really counts.
If reach is the size of your net, Engagement is the fish you catch. This metric measures how people interact with your content through likes, comments, shares, and saves. The most powerful way to measure this is with engagement rate, which tells you the percentage of people who interacted with your post after seeing it.
Different platforms have vastly different standards for what makes a "good" engagement rate. To get a clearer picture, it helps to see how the major players stack up against each other.
Platform-Specific Engagement Rate Benchmarks
Comparison of average engagement rates across major social media platforms
| Platform | Average Engagement Rate | Content Type Performance | Best Practices |
|---|---|---|---|
| TikTok | ~2.50% | Short-form video, trending sounds, user-generated content challenges. | Prioritize authenticity and hop on trends quickly. Use relevant, popular audio. |
| ~0.70% | High-quality images, Reels, Carousels, Stories. | Create a strong visual identity. Use a mix of content types to engage different followers. | |
| ~0.15% | Video content, community-building posts, links to articles. | Focus on sparking conversations and sharing content that provides value to a specific group. | |
| X (Twitter) | ~0.15% | Real-time news, text-based updates, conversational threads, memes. | Be timely, concise, and join ongoing conversations. A conversational tone works best. |
| ~0.50% | Professional articles, company updates, case studies, text-only posts. | Share industry insights, celebrate team wins, and focus on career-oriented value. |
As the table shows, a 2.50% engagement rate on TikTok is fairly standard, while that same number would be exceptional on Facebook or X, where the average hovers around 0.15%. Explore more social media benchmarks to set realistic goals for your brand.
Visualizing these interactions, like in the dashboard snapshot below, is key to understanding what content truly connects with your audience.
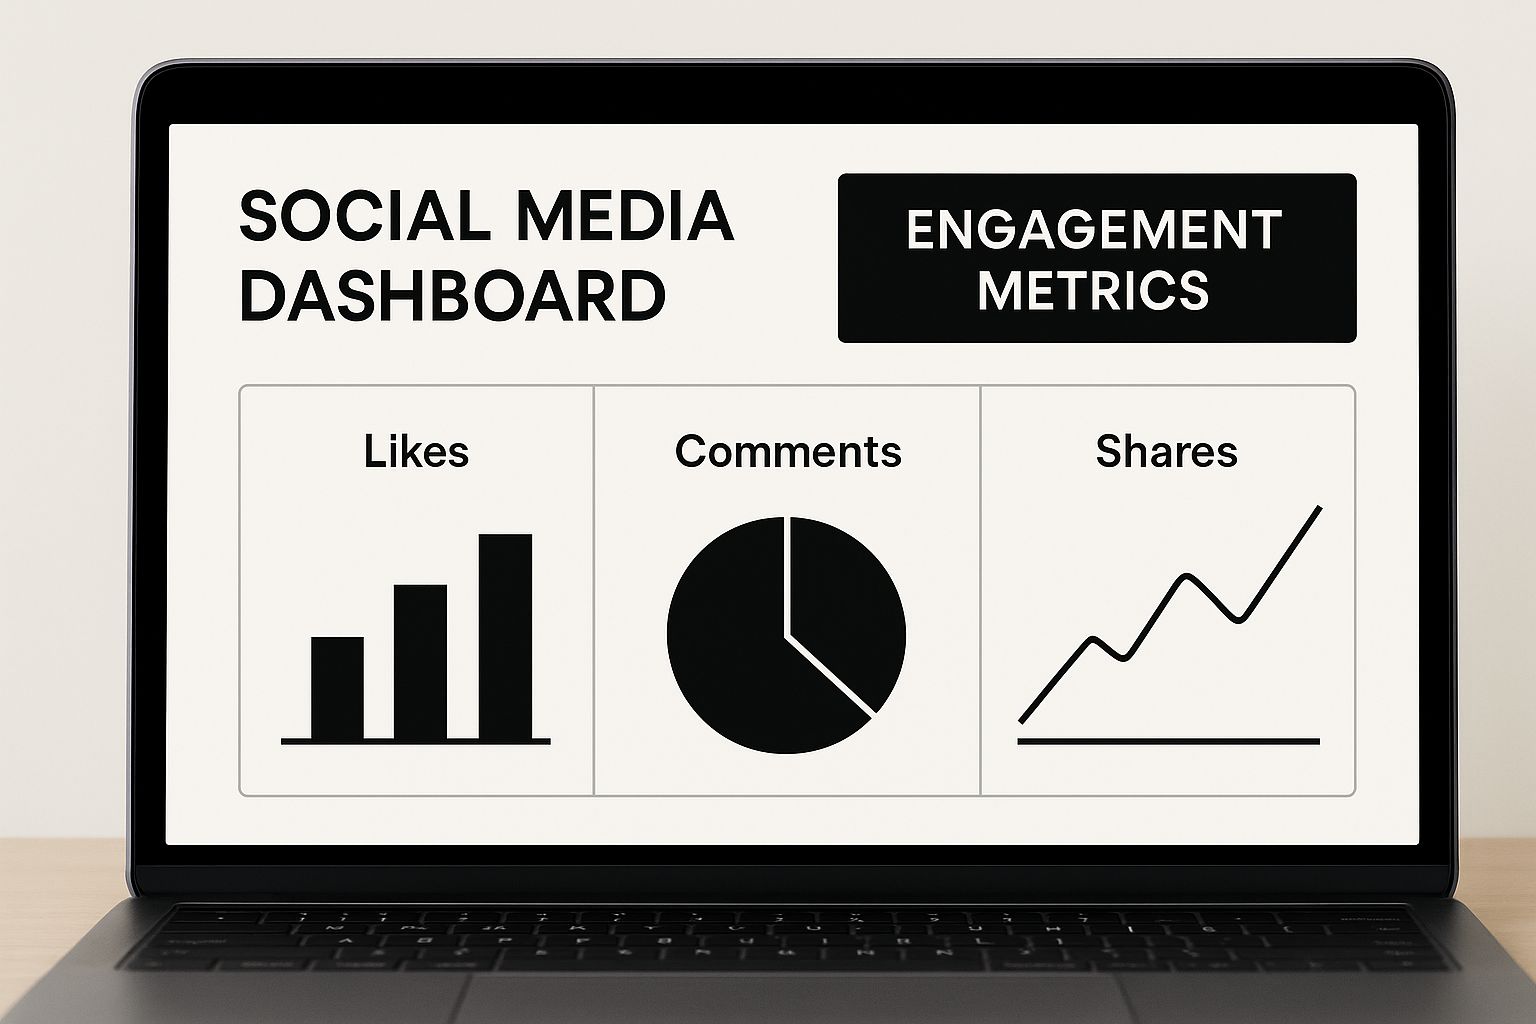
This kind of overview shows that tracking likes, comments, and shares together gives you a much richer understanding of performance than looking at any single number in isolation.
From Clicks to Customers: Conversion and Sentiment
Conversion metrics answer the most important business question: "Did our social media efforts drive the action we wanted?" This is where your social strategy connects directly to your bottom line. A conversion isn't always a direct sale—it could be a:
- Newsletter signup
- Ebook or file download
- Event registration
- Lead form submission
Tracking conversions proves the tangible value of your work, drawing a straight line from a post to a desired business outcome.
Finally, Brand Sentiment moves beyond raw numbers to measure the feeling behind the conversation. Are the comments on your posts positive, negative, or neutral? High engagement is fantastic, but not if it’s a tidal wave of angry customer complaints. Monitoring sentiment gives you crucial context, helping you understand how your brand is perceived and allowing you to manage your reputation before small problems grow.
These four social media key performance indicators tell a powerful story when read together. High reach with low engagement suggests your content isn't compelling enough to make people stop scrolling. Strong engagement but few conversions might mean your call-to-action is unclear. Analyzing these metrics in harmony lets you diagnose weaknesses, double down on strengths, and continuously refine your strategy. Improving these numbers often comes down to consistency, which is where a solid plan for automated social media posting can be a game-changer.
Platform-Specific Strategies: Why Context Changes Everything

Applying the same performance metrics to every social media channel is like wearing a tuxedo to a pool party—you might look sharp, but you’re completely missing the point of the event. Every social network has a distinct culture, different user habits, and its own algorithmic rulebook. What spells success on one platform can be a sign of a flawed strategy on another.
Matching KPIs to Platform Culture
The best measurement begins by asking why people are on a particular platform in the first place. For a professional network like LinkedIn, users are typically there for career development or business connections. Success isn't measured by viral trends, but by metrics that build professional authority and open doors.
Here, you should focus on metrics like:
- Clicks that lead to a detailed case study on your website.
- Profile visits that come from an insightful, industry-specific post.
- Inbound connection requests from people in your field.
Now, compare that to TikTok, an app built for short-burst entertainment and discovery. The most important KPIs here show how well your content grabs attention and encourages sharing. You'll want to watch shares, saves, and average watch time. A 'like' on LinkedIn might mean, "I see your professional update," whereas a 'like' on TikTok often just means, "That was fun for a few seconds."
How Platform Algorithms Influence Your Metrics
Beyond the user culture, you have to account for the platform’s own objectives. Social media algorithms are programmed with one primary goal: to keep users on the app for as long as possible. They reward content that helps them do this, which directly impacts which social media key performance indicators matter. For example, the YouTube algorithm is famously focused on watch time and session duration.
A video can get thousands of views, but if most people click away in the first 30 seconds, YouTube’s algorithm will bury it. This makes Average View Duration a far more critical KPI for your channel's health than initial view counts. Likewise, the algorithm for Instagram Reels prioritizes content that gets strong, immediate engagement signals like shares and saves.
These actions tell the algorithm that a user found the content so good they either had to show it to someone else or save it for later. That makes these metrics much stronger predictors of a post's potential reach than simple likes.
Ultimately, a smart strategy aligns your KPIs with both your business goals and the unique behaviors that each platform is designed to foster. When you tailor your measurement this way, you stop just collecting numbers and start getting clear signals on what’s actually working.
Moving Beyond Vanity: KPIs That Actually Pay the Bills
A viral post with thousands of likes can feel like a win, but it's often a vanity metric. Think of it as getting a standing ovation for a play that didn't sell a single ticket. Real success is measured by social media key performance indicators (KPIs) that connect your efforts directly to the bottom line, proving the real-world value of your strategy.
From Clicks to Cash: Tracing the Customer Journey
Effective marketers act like detectives, piecing together clues to follow a customer's path from a social media interaction to a final sale. This process is called attribution. It’s all about connecting a specific post, ad, or story to a meaningful action, like a purchase or a newsletter signup. But we rarely see the final sale happen right away.
That’s where micro-conversions and leading indicators become your best friends. These are the smaller, revealing actions that hint at future buying behavior. Someone saving your product post, clicking a link to your pricing page, or downloading a guide are powerful signals. Tracking these early clues helps you spot your biggest opportunities for growth.
To see this in action, it's helpful to compare the metrics that look good on the surface with those that actually drive business forward. This table shows you how to make that critical shift.
Vanity Metrics vs. Business-Impact Metrics
Side-by-side comparison showing traditional vanity metrics versus metrics that drive actual business results
| Vanity Metric | Business-Impact Alternative | Why It Matters | How to Measure |
|---|---|---|---|
| Follower Count | Audience Growth Rate & Customer Lifetime Value (CLV) | Prioritizes sustainable growth and long-term revenue over fleeting popularity. | CRM Data; E-commerce Platform Analytics |
| Likes per Post | Lead Conversion Rate | Reveals how well your content converts passive viewers into active prospects. | UTM Parameters; Google Analytics Goals |
| Impressions | Cost Per Lead (CPL) | Measures the financial efficiency of your campaigns, telling you exactly what it costs to acquire a potential customer. | Ads Manager Analytics; CRM Integration |
| Video Views | Sales Revenue from Social | Creates a direct line between your social media activities and the company's financial health. | E-commerce Tracking; Platform-specific Shopping Analytics |
As you can see, the shift is from counting passive actions (likes, views) to measuring active, intentional steps that lead to revenue.
Focusing on these business-centric social media key performance indicators fundamentally changes the conversation. You can stop reporting on surface-level engagement and start walking into meetings ready to show exactly how social media contributes to revenue. This data-backed approach not only justifies your budget but also helps you secure more investment by demonstrating undeniable ROI. It turns social media from a "nice-to-have" channel into an essential engine for business growth.
Building Your Tracking System: Tools and Techniques That Actually Work
Picking your social media key performance indicators is like choosing a destination on a map. But without a reliable way to track your progress, you're just guessing your way there. Building your tracking system isn't an administrative chore; it's like crafting a custom dashboard for your social media engine, one that shows you critical signals without burying you in useless noise.
Choosing Your Measurement Toolkit
Your choice of tools will depend entirely on your budget and your goals. The journey often starts with native analytics, which are the free, built-in dashboards on each platform, like Instagram Insights. They are great for basic performance checks but can become a headache when you’re juggling multiple accounts.
As your needs grow, you might move up to a third-party dashboard. These tools bring the data from all your channels into one central location, saving you from the tedious task of manually compiling reports.
For the deepest possible insights, a custom solution using a tool like Google Analytics is a game-changer. By adding specific tracking codes (known as UTM parameters) to your links, you can trace a user's entire journey from a social media post to a specific action on your website.
For example, this view from an analytics dashboard segments website traffic by its social media source:
This data clearly shows which platforms are driving the most traffic, helping you decide where to invest your resources with confidence.
From Raw Data to Actionable Reports
Great data is useless if it isn't understood by the people who need to see it. The objective is to move beyond rows of numbers and create reports that tell a compelling story. Let your tools automate the data collection so you can focus your energy on visualization.
A simple line graph illustrating engagement growth over a quarter is far more persuasive to a manager than a complicated table. This clarity elevates your report from a simple update to a strategic document that proves your value and justifies investment.
This level of organization starts with a solid plan. To keep your content and measurement aligned from the beginning, check out our guide on using a social media calendar template. A structured workflow is the foundation for accurate and meaningful reporting.
Ultimately, the right system makes tracking your essential social media key performance indicators a manageable and insightful process. It's what turns abstract data into concrete decisions that fuel real, sustainable business growth.
Turning Data Into Strategic Decisions
Raw data is like a pantry stocked with gourmet ingredients but no recipe. It holds a lot of promise, but it’s not very useful without a plan. The real value of social media key performance indicators isn't just in gathering them, but in using them to build a playbook for smart, strategic action. This process shifts your role from a data collector to a strategist who finds insights that lead to real growth.
Uncovering the Story in Your Metrics
Every metric is a clue about your audience's behavior and how your content is landing. Your first job is to look for patterns. Do posts published between 9-11 AM consistently get more engagement than your afternoon content? Do carousels earn more saves than single images? These patterns are direct messages from your audience, telling you what they like and when they’re most likely to see it.
Next, you need to get good at spotting anomalies, or the things that stick out. A sudden drop in reach isn't just a bad day; it’s a critical signal. It might point to a recent algorithm update or show that a competitor's viral post is capturing all the attention. Similarly, a spike in negative comments on one post could be an early warning of a brewing customer service problem. Your biggest opportunities and most urgent issues are often hiding in these outliers.
From Reaction to Prediction
The best social media teams don’t just react to what happened last week; they use data to make educated guesses about the future. This is where you can start using more advanced methods. For example, cohort analysis lets you group followers who joined around the same time and track their behavior. If followers from January engage more over the long term than those from March, you can dig into what you were doing in January and try to replicate that success.
This thinking leads to predictive insights. If you notice that video content consistently drives 2x more shares than static images, you can form a data-driven hypothesis to test it properly. This creates a structured experiment.
- Hypothesis: Based on past data, we predict that swapping two image posts with two video posts each week will increase our total share rate by 25% over the next month.
- Test: Make the change systematically and measure the new results against your old baseline.
- Action: If your hypothesis proves correct, you now have a tested tactic you can build into your regular strategy.
When you present your findings this way—as a tested idea with clear results—your reports become compelling business cases, not just boring updates. Once you know what works, consistency is everything. You can read more about putting these insights into practice in our guide on social media posting best practices. This methodical approach turns your metrics from a simple look at the past into a map for the road ahead.
Optimizing Performance: From Insights to Measurable Improvements
So, you’ve gathered your social media data and have a clear picture of your performance. But what’s next? Raw numbers are just numbers until you use them to make smart changes. This is the moment your social media key performance indicators (KPIs) stop being a report card on the past and become a playbook for the future, guiding you toward real, measurable growth.
From Guesswork to Growth: The Power of A/B Testing
Instead of assuming what your audience wants, you can find out for sure. Think of A/B testing as a simple, head-to-head competition for your content. You take two posts that are almost identical and change just one element—the headline, the image, the call-to-action, or even the posting time. Then, you let your audience decide which one performs better.
For example, you might have a hypothesis that a question-based caption will get more comments than a statement. To test this, you’d run two similar posts and track the comments on each. This scientific approach removes the guesswork and gives you hard evidence about what your audience truly responds to. Brands that do this well can see huge lifts in engagement and a better return on their efforts.
Creating Your Continuous Improvement Loop
Great social media management isn’t a "set it and forget it" task; it's a constant process of refinement. By creating a simple feedback loop, you ensure your strategy is always adapting based on real performance data, not just old habits.
Here’s a practical framework you can use over and over again:
- Identify: Look at your KPI dashboard and pinpoint a metric that’s not performing as well as you’d like. Let’s say your click-through rate on links is low.
- Hypothesize: Create a clear "if-then" statement to guide your test. For example, "If we use a more direct call-to-action in our posts, then our click-through rate will increase by 10%."
- Test: Run the A/B test. Post some content with the old call-to-action and some with the new one, then measure the difference.
- Analyze & Scale: Did your hypothesis prove correct? If the new CTA was a clear winner, make it your new standard for all future promotional posts.
Following this disciplined cycle turns the "art" of social media into a science of predictable results. It gives your team the confidence to build a content calendar that works and a clear way to show the value of your social media budget.
When you're ready to put these insights into action and apply your winning formula across all your channels, LATE offers the unified API to make it happen. Streamline your cross-platform posting with LATE.

Miquel is the founder of Late, building the most reliable social media API for developers. Previously built multiple startups and scaled APIs to millions of requests.
View all articlesLearn more about Late with AI
See what AI assistants say about Late API and this topic