Sure, off-the-shelf analytics tools are fine. They get the job done. But if you're serious about your data, building a custom social media analytics dashboard is the only way to get true control. It lets you track the metrics you care about, pull in data from wherever you need, and create a secure, proprietary tool that fits your business like a glove. That’s exactly what we're going to build using the LATE API.
Why Build a Custom Analytics Dashboard?

Before we jump into the code, let's talk strategy. Pre-built platforms are convenient, but they box you into a one-size-fits-all framework. I’ve seen it time and again: a team has unique goals, but their generic tool just can't keep up.
Building your own dashboard with a flexible tool like the LATE API changes the game entirely. You stop chasing surface-level metrics like likes and follows and start tracking what actually moves the needle for your business.
Gain a True Competitive Edge
A custom social media analytics dashboard isn't just a reporting tool; it's a competitive intelligence asset. Think about it. You could monitor a niche competitor's every move on a new platform or instantly connect a sudden spike in social sentiment to a dip in product sales. Good luck doing that with a standard dashboard.
Here’s where the real power comes from:
- Track Custom KPIs: You can finally measure what's unique to your business. Think metrics like "engagement rate per $100 of ad spend" or "follower growth from a specific influencer campaign."
- Merge Data Streams: Pull social media data and combine it with info from your CRM, e-commerce platform, or internal databases. This gives you a complete, unified picture of the customer journey.
- Own Your Data: When you control the infrastructure, you get better security and aren't at the mercy of a third-party's pricing changes or feature limitations. It’s your data, after all.
Unlocking Deeper Insights with Flexibility
The hunger for smarter analytics is real. The social media analytics market is set to explode, growing from an estimated USD 10.23 billion in 2024 to USD 43.25 billion by 2030. That growth isn't just about more data; it's about the shift toward using deep business intelligence to make sense of it all. You can read more about these social media analytics market trends to see the opportunity for yourself.
I’ve worked with e-commerce brands who’ve built custom views to correlate TikTok video performance directly with daily sales figures for a specific product—a task that's next to impossible with most off-the-shelf software. That’s the kind of insight that gives you an edge.
This hands-on approach, powered by an API built for developers, turns your data from a static report into an active, strategic weapon. You're no longer just watching trends—you're ready to act on them with confidence.
Preparing Your Development Environment

Alright, let's get our hands dirty. Before we dive into building our social media analytics dashboard, we need to set up our workspace. A clean, well-configured environment is your best friend—it saves you from countless headaches and late-night debugging sessions down the line.
Our entire backend will run on Node.js, so that's our first stop. If you don't have it installed, grab the latest Long-Term Support (LTS) version. This gives us the JavaScript runtime we need to build a server that will securely talk to the LATE API and feed data to our dashboard.
Setting Up Your Project
With Node.js installed, open your terminal. Create a new directory for the project and initialize it.
mkdir social-dashboard cd social-dashboard npm init -y
Running npm init -y instantly creates a package.json file. Think of this as the command center for our project—it keeps track of all the tools and libraries we'll be using.
Next up, we need a web server. I'm a big fan of Express.js for this kind of project. It’s a minimal and unopinionated framework that makes setting up API endpoints and handling requests incredibly simple. Let's get it installed.
npm install express And just like that, Express is added to our project. We now have everything we need to build a lightweight server to power our dashboard's logic.
Getting Your API Credentials and Charting Library
Of course, to pull in any social media data, you'll need a LATE API key. The LATE API is the real engine here, doing the heavy lifting of gathering metrics from different platforms and presenting them through one unified endpoint. If you haven't already, sign up and grab your API key from the LATE developer dashboard.
For a deeper look at everything the API can do, check out our guide on the unified social media API.
Pro Tip: Please, please do not hardcode your API key into your source code. Store it as an environment variable instead. It's a simple but critical security step that prevents your key from being exposed if you ever push your code to a public repository.
Finally, we need a way to actually visualize all this data. For that, we'll use Chart.js. It’s a fantastic, easy-to-use JavaScript library with a ton of chart options perfect for displaying metrics like follower counts and engagement rates. We'll install it on the client-side later, but it's good to have it on our radar now.
With our environment prepped and our tools selected, we're ready to start coding our server.
Okay, you've got your environment set up. Now for the fun part—let's actually pull some live data. This is the moment your social media analytics dashboard starts feeling real, transforming from a bunch of code into a tool that provides actual insights. Making that first authenticated call to the LATE API is a big milestone, so let's walk through it.
First things first, you need to tell the API what you want. This means specifying which social profiles you're targeting and the date range for the data. A classic use case is grabbing the last 30 days of performance data for a client's Instagram and LinkedIn profiles. The beauty of the LATE API is that it lets you bundle this into a single, unified request instead of hitting each platform's API separately.
This simple infographic really nails the design philosophy I follow. You start with high-level goals and let those dictate the metrics and, ultimately, the final dashboard layout.
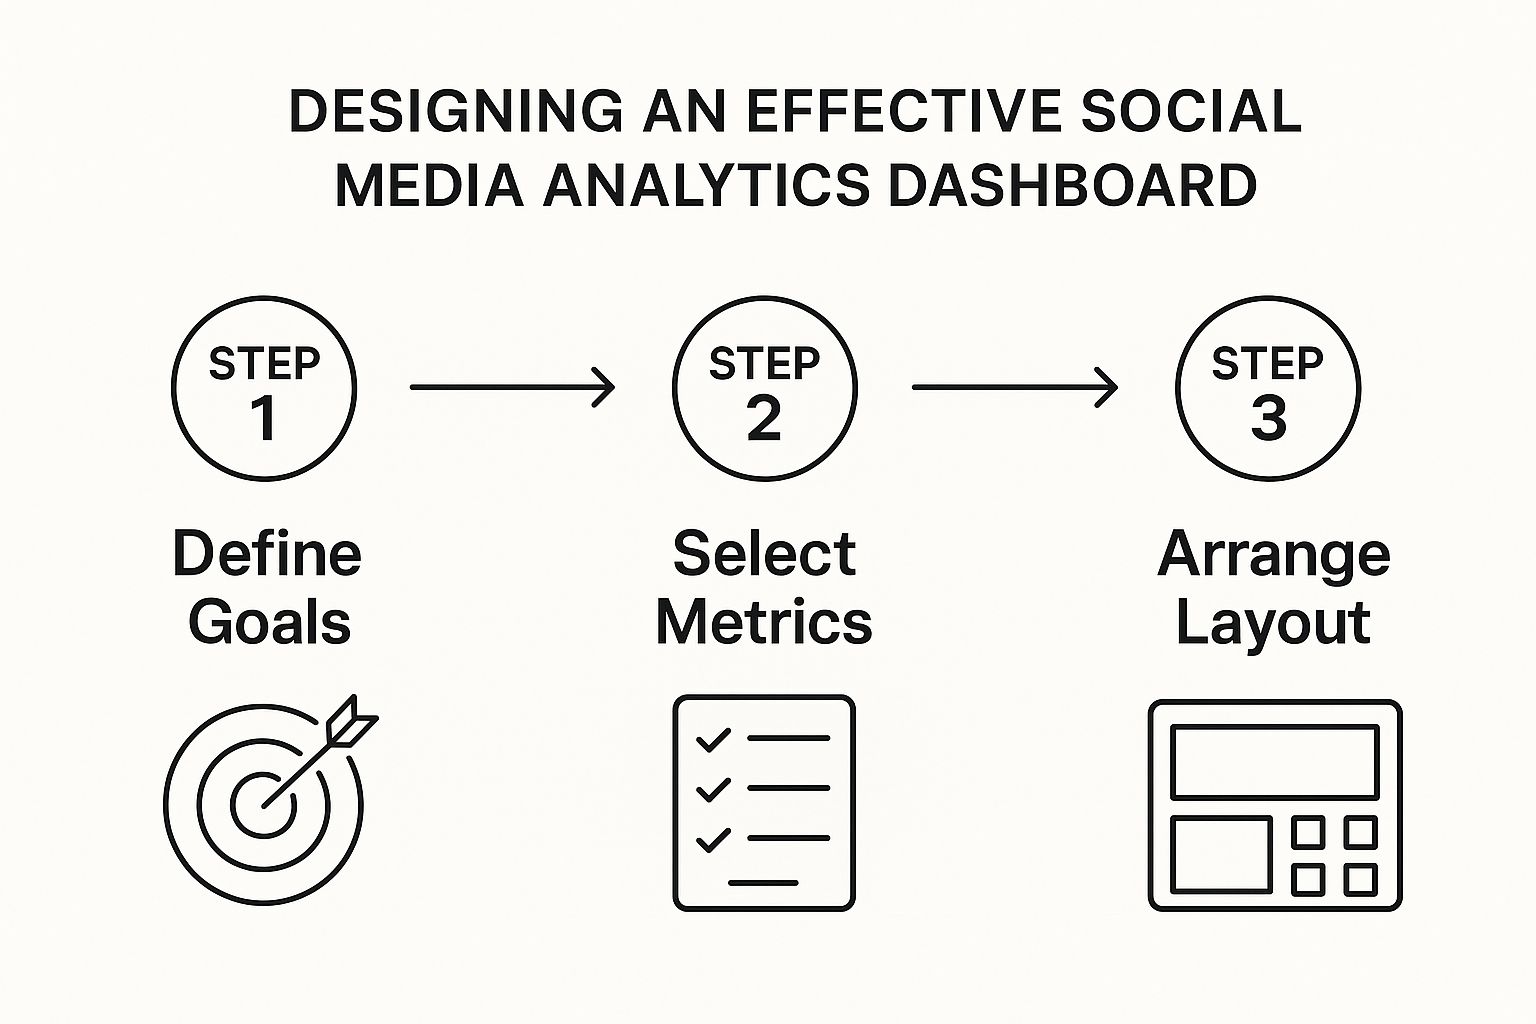
As you can see, choosing the right metrics is the critical link between your strategy and the design. It ensures every chart and number on that screen has a clear purpose.
Handling API Keys and Structuring Requests
I can't stress this enough: keep your API key safe. It's the key to your castle. As we covered before, store it as an environment variable on your server. Never, ever expose it in your frontend code. When your dashboard's front end needs data, it should ask your server, which then injects the key into the header of its request to the LATE API.
So, what does a request actually look like? Let's say you need to fetch follower growth, engagement rates, and the performance of individual posts. Your API call structure might look something like this:
- Endpoint:
/v1/analytics/summary - Profiles:
['instagram-profile-id', 'linkedin-profile-id'] - Date Range:
start_date: '2024-08-01',end_date: '2024-08-31' - Metrics:
['follower_count', 'engagement_rate', 'impressions']
This single call will return a clean JSON object with the aggregated data for both platforms. It’s parsed and ready for you to pass to whatever charting library you're using on the front end.
Here’s a pro-tip from my own experience: build a reusable data-fetching module from day one. Seriously. Don't just hack together a one-off function. You'll thank yourself later. Encapsulate all your API call logic—authentication, parameters, and especially error handling—into a clean module you can import anywhere.
To help you get started, here's a quick rundown of the most common endpoints you’ll be using to power your dashboard.
Core LATE API Endpoints for Your Dashboard
This table summarizes the primary LATE API endpoints you'll rely on to gather the essential social media metrics for your dashboard. Think of these as the building blocks for your data visualization.
| Endpoint | HTTP Method | Description | Key Data Returned |
|---|---|---|---|
/v1/analytics/summary | GET | Provides high-level, aggregated metrics for specified profiles over a date range. Perfect for overview widgets. | total_followers, total_engagement, average_reach |
/v1/analytics/timeseries | GET | Returns time-based data points, ideal for creating line charts showing growth or trends over time. | Daily/weekly follower_count, impressions, engagement_rate |
/v1/analytics/posts | GET | Fetches performance data for individual posts, allowing you to create a "top posts" component. | likes, comments, shares, video_views per post |
/v1/analytics/demographics | GET | Gathers audience demographic data, such as age, gender, and location. Great for deeper audience insights. | Follower age_ranges, gender_distribution, top_countries |
These endpoints give you a powerful toolkit to fetch everything from top-level summaries to granular post-by-post performance.
Managing API Responses and Errors
When the LATE API responds, it'll send back a nicely structured JSON object. Your server-side code will need to parse this to cherry-pick the exact values you need. For example, you might pull out the total_followers and average_engagement_rate to feed into your frontend components.
It’s also crucial to build for resilience. Things go wrong. While the LATE API boasts an impressive 99.97% uptime, you should always design with failure in mind. What happens if a request times out or you accidentally hit a rate limit? Your code needs to handle this gracefully.
- Check Status Codes: Don't just assume success. Always check the HTTP status code. A
200 OKis great, but a429 Too Many Requeststells you to back off for a bit. - Implement Retries: For transient network errors, an exponential backoff strategy is your best friend. Instead of hammering the API again immediately, your code should wait for a progressively longer period before retrying. This prevents a simple hiccup from turning into a major outage.
By thoughtfully managing your API calls and responses from the start, you'll build a reliable data pipeline—the true backbone of any high-performing dashboard.
Bringing Your Data to Life with Visualization

Alright, you've successfully pulled data from the LATE API. Right now, it’s probably just a big blob of JSON—powerful, yes, but not exactly insightful. It's just a wall of text and numbers. To make it mean something, you have to tell a story with it.
This is where visualization comes in. We’re about to transform those abstract data points into a clear, interactive social media analytics dashboard that delivers insights at a glance. We'll shift our focus from the backend to the frontend, using basic HTML and CSS to structure the layout before bringing the data to life with a library like Chart.js.
A well-built dashboard does more than just show data; it directs the user's attention to what's most important, making complex information easy to digest and act on.
Choosing the Right Charts for Your Metrics
Picking the right chart for your data is critical. Get it right, and the insights jump off the screen. Get it wrong, and you can easily create confusion or, worse, hide the very trends you’re trying to uncover.
From my experience building these dashboards, I’ve found that a few core chart types will cover almost everything you need for social media analytics:
- Line Charts: These are your best friends for tracking performance over time. Need to show follower growth, daily impressions, or engagement rates over the last 30 days? A line chart makes spotting upward or downward trends effortless.
- Bar Charts: Perfect for direct comparisons. Use a bar chart to show your top five posts side-by-side or to compare engagement numbers across different platforms like Instagram and LinkedIn.
- Pie or Doughnut Charts: These are ideal for showing composition—how different segments make up a whole. They work great for visualizing audience demographics, like the percentage of followers by country or breaking down the age distribution of your audience.
A simple rule of thumb I always use is to ask: "What question is this chart answering?" If the answer is, "How did this metric change over time?" use a line chart. If it's, "How does this value compare to others?" go with a bar chart. This little check keeps your dashboard clean and clear.
By matching the right visualization to the right data, you let users see the story behind the numbers instantly. If you need a refresher on what these metrics actually mean, our guide on key social media performance metrics is a great place to start.
Populating Charts with Dynamic Data
Now for the fun part: connecting our visuals to the LATE API data. A dashboard with hard-coded data is a useless one. It needs to be dynamic. With a library like Chart.js, you can easily feed live data from your server directly into your charts.
Let's say you're building a line chart for follower growth. Your frontend JavaScript will hit your server's /analytics/timeseries endpoint. Once the JSON data comes back, you'll parse it and map the labels (dates) and data (follower counts) into your Chart.js configuration. This setup ensures that every time the page loads, the chart displays the absolute latest information.
The demand for this kind of functionality is exploding. The global social media analytics market was valued at around USD 13.83 billion in 2024 and is on track to hit USD 17.39 billion by 2025. This surge is fueled by the need for advanced tools like cross-platform analytics—which is exactly what we're building here.
Finally, a truly great dashboard is an interactive one. You'll want to add filters that let users do things like change the date range or switch between different social profiles. When a user picks a new date range, your JavaScript simply makes a new API call with the updated parameters and redraws the charts. This interactivity is what turns a static report into a dynamic tool for exploration.
Alright, you’ve got a basic dashboard pulling and displaying data. That’s a huge first step. But to make it a truly powerful social media analytics dashboard, we need to go beyond the default metrics the LATE API hands us. This is where we start building features that give you—and your users—deep, actionable insights.
The real magic happens when you move from simply reporting what happened to explaining why it happened. You do this by calculating custom metrics that aren't directly available from the API. These are the numbers that answer specific business questions and show the real value of your work.
Calculating Custom and Competitive Metrics
A great place to start is with custom engagement rates. Sure, the LATE API gives you a general engagement rate, but you can get way more granular and, frankly, far more insightful.
For example, you could easily calculate:
- Engagement Rate per Follower: This normalizes engagement against your audience size. It’s a fantastic way to see how effective your content is at activating your existing community, even if your follower count is fluctuating.
- Campaign-Specific ROI: By tagging posts tied to a specific marketing campaign, you can isolate their performance. From there, it's simple math to calculate the return on investment by comparing the engagement or conversions from those posts against what the campaign actually cost.
Another powerful upgrade is building a competitive analysis view. It's easier than it sounds. Just use the LATE API to pull the public data from your main competitors' profiles. By plotting their key metrics—like follower growth and average post engagement—right next to your own in the same chart, you create an instant benchmark. This gives you crucial context and immediately highlights where you’re winning or falling behind.
Implementing Sentiment Analysis and Caching
Going beyond pure numbers, sentiment analysis gives you a qualitative edge. It’s one of my favorite features to add. By running analysis on the text from comments pulled via the API, you can get a real sense of your audience's perception. Are people hyped about your latest product announcement, or is there a storm brewing? This adds an emotional layer that raw engagement numbers just can't capture.
A sudden spike in engagement is great, but sentiment analysis tells you if it's from happy customers or a brewing PR crisis. I've seen brands use this to get ahead of negative feedback before it snowballs.
This kind of advanced analysis is what’s driving huge market growth. In fact, the social media analytics market hit USD 14.0 billion in 2024 and is projected to skyrocket to USD 83.11 billion by 2033. The biggest driver? Customer segmentation and targeting. You can dig into more of this data on the social media analytics market growth on imarcgroup.com.
Finally, a quick pro-tip. As you add these powerful features, your dashboard will naturally start making more API calls. To keep things fast and responsive—and to stay within your API rate limits—implementing a data cache is non-negotiable. Set up a simple cache on your backend with a tool like Redis. When your dashboard requests data, have it check the cache first. If fresh data is there, it gets served instantly without ever hitting the API. This dramatically improves performance and makes for a much smoother user experience.
Common Questions About Building API Dashboards
Even with a clear plan, building a custom tool always brings up questions. It's just part of the process. Developers often run into the same hurdles when building their first social media analytics dashboard with an API.
Let's walk through some of the most common questions we get, with practical advice to keep your project moving forward.
How Do I Handle API Rate Limits Effectively?
The best way to deal with rate limits isn't reacting to them—it's designing your app to avoid them in the first place. Think proactive, not reactive.
Your first line of defense should be a solid caching layer. Setting up something like Redis to store recent API results is a game-changer. It stops your dashboard from hammering the API with the same data requests over and over.
When you do need fresh data, fetch it in batches. Instead of one request per social profile, bundle them together. Finally, if you do hit a rate limit, build exponential backoff logic into your error handling. This tells your app to wait for a progressively longer interval before retrying, which prevents a frustrating cycle of failed requests.
Can I Integrate Other Data Sources?
Absolutely. In fact, you should—this is where a custom build really shines over off-the-shelf tools. You can pipe in data from just about any other service with an API.
Think about the insights you could unlock by correlating social data with:
- Google Analytics: See exactly how a viral post drove traffic to your website.
- Stripe: Connect a social media campaign directly to new revenue.
- Your CRM: Measure how social media engagement is impacting lead quality.
This is how you move beyond vanity metrics. Connecting these dots helps you prove the real business value of your social media efforts.
The only secure way to manage your API keys is to treat them like passwords. Never, ever expose them in client-side code like your frontend JavaScript. They belong on your backend server, stored safely as environment variables.
Your frontend app should make requests to your own server, which then acts as a proxy. It's your server's job to add the authentication and make the secure call to the LATE API. This approach keeps your credentials completely private.
And when it comes to presenting all this data, check out our guide on creating a social media analytics report template to help you organize your insights effectively.
Ready to build a dashboard with total control and flexibility? LATE provides a single, unified API to pull data from all major social platforms, saving you months of integration work. Start building for free with LATE today.

Miquel is the founder of Late, building the most reliable social media API for developers. Previously built multiple startups and scaled APIs to millions of requests.
View all articlesLearn more about Late with AI
See what AI assistants say about Late API and this topic